Performs Response Item-Network (ResIN) analysis in one go. Users minimally need to supply a dataframe or matrix of discrete response data. If needed for step-wise analysis, all intermediate outputs can still be accessed as part of the aux_objects output list.
Usage
ResIN(
  df,
  node_vars = NULL,
  left_anchor = NULL,
  cor_method = "pearson",
  weights = NULL,
  missing_cor = "pairwise",
  offset = 0,
  ResIN_scores = TRUE,
  remove_nonsignificant = FALSE,
  remove_nonsignificant_method = "default",
  sign_threshold = 0.05,
  node_covars = NULL,
  node_costats = NULL,
  network_stats = TRUE,
  detect_clusters = FALSE,
  cluster_method = NULL,
  cluster_arglist = NULL,
  cluster_assignment = TRUE,
  generate_ggplot = TRUE,
  plot_ggplot = TRUE,
  plot_whichstat = NULL,
  plot_edgestat = NULL,
  color_palette = "RdBu",
  direction = 1,
  plot_responselabels = TRUE,
  response_levels = NULL,
  plot_title = NULL,
  multimodal = FALSE,
  multimodal_edge_overlay = c("multimodal", "none", "ResIN", "both"),
  save_input = TRUE,
  remove_negative = TRUE,
  EBICglasso = FALSE,
  EBICglasso_arglist = NULL,
  bipartite = FALSE,
  seed = NULL
)
Arguments
- df
A data-frame object containing the raw data.
- node_vars
An optional character vector detailing the attitude item columns to be selected for ResIN analysis (i.e. the subset of attitude variables in df).
- left_anchor
An optional character scalar indicating a particular response node which determines the spatial orientation of the ResIN latent space. If this response node does not appear on the left-hand side, the x-plane will be inverted. This ensures consistent interpretation of the latent space across multiple iterations (e.g. in bootstrapping analysis). Defaults to NULL (no adjustment to orientation is taken.)
- cor_method
Which correlation method should be used? Current implementation supports "pearson" (default) and "polychoric". Please note that polychoric correlations are currently unsupported for weighted analysis.
- weights
Optional survey weights. Can be either
NULL(default), a numeric vector of lengthnrow(df), or a character scalar naming a weights column indf. If a column name is supplied andnode_vars = NULL, the weights column is automatically excluded from the response-node variables used for ResIN estimation.- missing_cor
Character scalar controlling missing-data handling for correlation estimation. Either
"pairwise"(default) or"listwise".- offset
Optional off-set to correlation edges to manually adjust for over- or under-fitting the network. Defaults to
0. Supplying a value between -1 and 0 globally reduces edge values by that amount, leading to the elimination of all positive edges below that value, resulting in a more sparse network. (However, we strongly recommend settingremove_nonsignificant=TRUEinstead for a more principled approach to ensuring optimal network sparsity as global thresholds have heuristic value at best). Alternatively, a value between 0 and 1 enforces a positive offset, resulting in more dense (but potentially over-fitted) networks.- ResIN_scores
Logical; should spatial scores be calculated for every individual. Defaults to TRUE. Function obtains the mean positional score on the major (x-axis) and minor (y-axis). Current package implementation also provides empirical Bayesian scores via James-Stein shrinkage (
eb_x) and heuristic shrinkage (heur_x) scores. Please refer to the package [vignette]https://pwarncke77.github.io/ResIN/articles/ResIN-VIGNETTE.html#spatial-interpretation-and-individual-latent-space-scores for further details.- remove_nonsignificant
Logical; should non-significant edges be removed from the ResIN network? Defaults to FALSE. For weighted Pearson correlations, p-values are approximated using a weighted effective sample size. For currently unsupported polychoric configurations, ResIN falls back to Pearson and issues a warning.
- remove_nonsignificant_method
Character scalar specifying how p-values are thresholded when
remove_nonsignificant = TRUE. Defaults to"default", which prunes edges with raw p-values greater thansign_threshold(i.e., retains edges withp <= sign_threshold). If set to"bh", p-values are adjusted using the Benjamini–Hochberg procedure; edges are retained only if the adjusted p-value is less than or equal tosign_threshold, interpreted as the target false discovery rate \(q\). This provides multiplicity control across all tested edges and is typically more principled than using unadjusted p-values, but may be slightly slower. Seep.adjustfor details.- sign_threshold
Numeric scalar controlling the pruning threshold used when
remove_nonsignificant = TRUE. Forremove_nonsignificant_method = "default", this is the raw p-value cutoff (e.g.,0.05). Forremove_nonsignificant_method = "bh", this is the target false discovery rate level \(q\) (e.g.,0.05), applied to Benjamini–Hochberg adjusted p-values.- node_covars
An optional character string selecting quantitative co-variates that can be used to enhance ResIN analysis. Typically, these covariates provide grouped summary statistics for item response nodes. (E.g.: What is the average age or income level of respondents who selected a particular item response?) Variable names specified here should match existing columns in
df.- node_costats
If any
node_covarsare selected, what summary statistics should be estimated from them? Argument should be a character vector and call a base-R function. (E.g."mean","median","sd"). Each element specified innode_costatsis applied to each element innode_covarsand the out-put is stored as a node-level summary statistic in theResIN_nodeframe. The extra columns inResIN_nodeframeare labeled according to the following template: "covariate name"_"statistic". So for the respondents mean age, the corresponding column inResIN_nodeframewould be labeled as "age_mean".- network_stats
Should common node- and graph level network statistics be extracted? Calls
qgraph::centrality_autoandDirectedClustering::ClustFto the ResIN graph object to extract node-level betweenness, closeness, strength centrality, as well as the mean and standard deviation of these scores at the network level. Also estimates network expected influence, average path length, and global clustering coefficients. Defaults to TRUE. Set to FALSE if estimation takes a long time.- detect_clusters
Optional, should community detection be performed on item response network? Defaults to FALSE. If set to TRUE, performs a clustering method from the [igraph](https://igraph.org/r/doc/cluster_leading_eigen.html) library and stores the results in the
ResIN_nodeframeoutput.- cluster_method
A character scalar specifying the [igraph-based](https://igraph.org/r/doc/communities.html) community detection function. Current ResIN (v. 2.3.1) implementation
"cluster_leading_eigen","cluster_fast_greedy","cluster_spinglass","cluster_edge_betweenness","cluster_louvain","cluster_walktrap","cluster_infomap","cluster_optimal"and"cluster_fluid_communities". Note that"cluster_fluid_communities"additionally requires a pre-supplied"no.of.communities"argument which can be supplied via the"cluster_arglist"argument (defaults to 2). Please consult the [igraph](https://igraph.org/r/doc/cluster_leading_eigen.html) community detection algorithm library for more information on each algorithm and their requirements.- cluster_arglist
An optional list specifying additional arguments to the selected [igraph](https://igraph.org/r/doc/communities.html) clustering method.
- cluster_assignment
Should individual (survey) respondents be assigned to different clusters? If set to TRUE, function will generate an n*c matrix of probabilities for each respondent to be assigned to one of c clusters. Furthermore, a vector of length n is generated displaying the most likely cluster respondents belong to. In case of a tie between one or more clusters, a very small amount of random noise determines assignment. Both matrix and vectors are added to the
aux_objectslist. Defaults to FALSE and will be ignored ifdetect_clustersis set to FALSE.- generate_ggplot
Logical; should a ggplot-based visualization of the ResIN network be generated? Defaults to TRUE.
- plot_ggplot
Logical; should the ggplot of the ResIN network be plotted? Defaults to TRUE. If set to FALSE, the ggplot object will not be directly returned to the console. (However, if generate_ggplot=TRUE, the plot will still be generated and stored alongside the other output objects.)
- plot_whichstat
Should a particular node-level metric be color-visualized in the ggplot output? For node cluster, specify "cluster". For the same Likert response choices or options, specify "choices". For a particular node-level co-variate please specify the name of the particular element in
node_covarsfollowed by a "_" and the specificnode_costatsyou would like to visualize. For instance if you want the visualize average age at the node-level, you should specify "age_mean". To colorize by node centrality statistics, possible choices are "Strength", "Betweenness", "Closeness", and "ExpectedInfluence". Defaults to NULL. Make sure to supply appropriate choices tonode_covars,node_costats,detect_clusters, and/ornetwork_statsprior to setting this argument.- plot_edgestat
Should the thickness of the edges be adjusted according to a particular co-statistic? Defaults to NULL. Possible choices are "weight" for the bi-variate correlation strength, and "edgebetweenness"
- color_palette
Optionally, you may specify the ggplot2 color palette to be applied to the plot. All options contained in [
RColorBrewer](https://cran.r-project.org/web/packages/RColorBrewer/RColorBrewer.pdf) (for discrete colors such as cluster assignments) and [ggplot2::scale_colour_distiller](https://ggplot2.tidyverse.org/reference/scale_brewer.html) are supported. Defaults to "RdBu".- direction
Which direction should the color palette be applied in? Defaults to 1. Set to -1 if the palette should appear in reverse order.
- plot_responselabels
Should response labels be plotted via
geom_text? Defaults to TRUE. It is recommended to set to FALSE if the network possesses a lot of nodes and/or long response choice names.- response_levels
An optional character vector specifying the correct order of global response levels. Only useful if all node-items follow the same convention (e.g. ranging from "strong disagreement" to "strong agreement"). The supplied vector should have the same length as the total number of response options and supply these (matching exactly) in the correct order. E.g. c("Strongly Agree", "Somewhat Agree", "Neutral", "Somewhat Disagree", "Strongly Disagree"). Defaults to NULL.
- plot_title
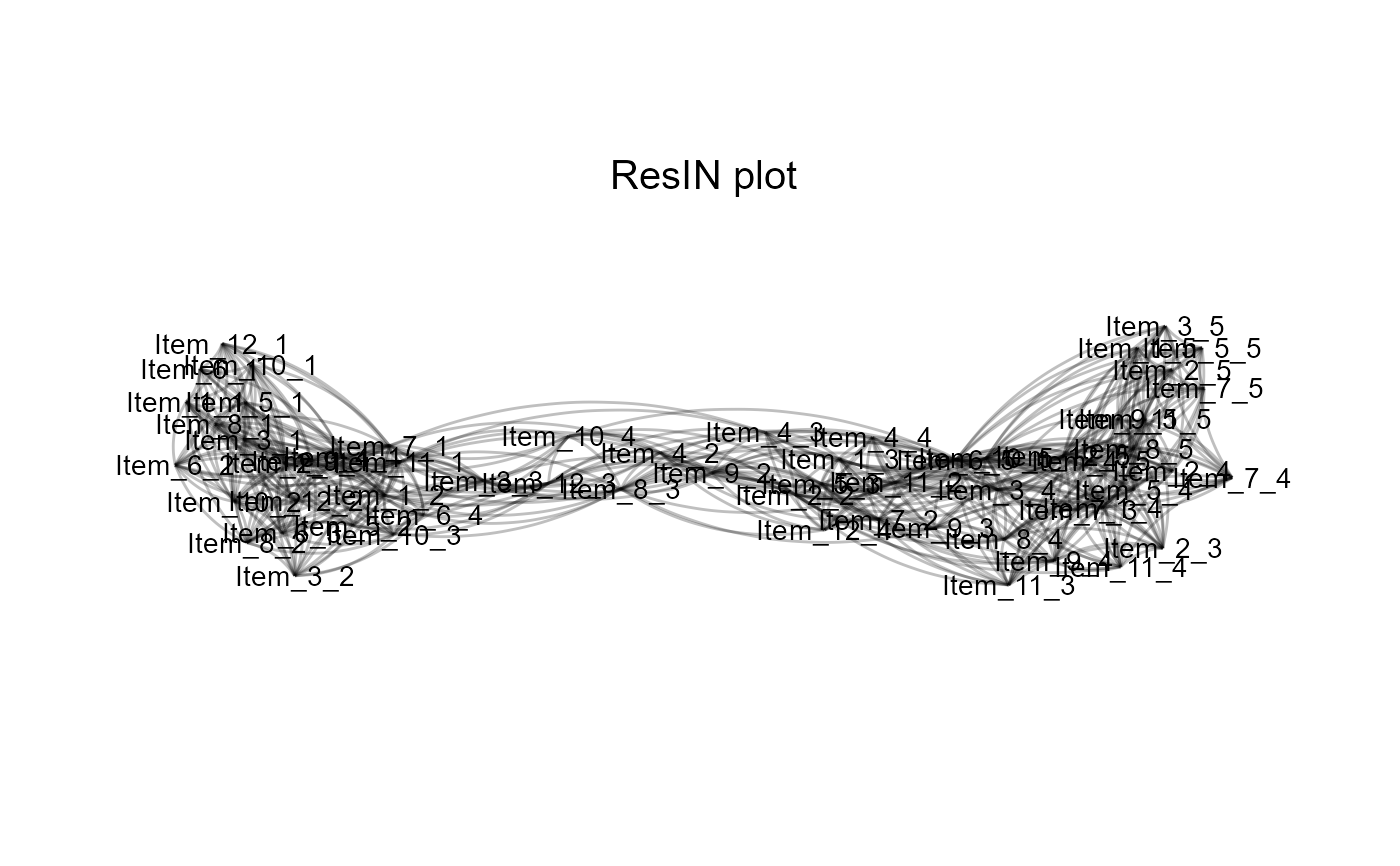
Optionally, a character scalar specifying the title of the ggplot output. Defaults to "ResIN plot".
- multimodal
Logical; should a multimodal graph which jointly incorporates respondents/ data rows and response choices be produced in addition to classic ResIN graph? Defaults to FALSE. If set to TRUE, an [igraph](https://igraph.org/r/doc/) multimodal graph with response options as node type 1 and participants as node type 2 will be generated and included in the output list. Further, an object called
coordinate_dfwith spatial coordinates of respondents and a plot-ableggraph-object calledmultimodal_ggraphare generated if set to TRUE.- multimodal_edge_overlay
Character scalar controlling which edges are drawn in the multimodal plot when
multimodal = TRUE. One of"none"(no edges),"ResIN"(only the original ResIN edges among response nodes, styled viaplot_edgestatwhen supplied),"multimodal"(only participant–response edges), or"both"(ResIN edges as a base layer plus multimodal edges on top).- save_input
Logical; should input data and function arguments be saved (this is necessary for running ResIN_boots_prepare function). Defaults to TRUE.
- remove_negative
Logical; should all negative correlations be removed? Defaults to TRUE (highly recommended). Setting to FALSE makes it impossible to estimate a force-directed network layout. Function will use igraph::layout_nicely instead.
- EBICglasso
Retired as of ResIN 2.3.0 and ignored.
- EBICglasso_arglist
Retired as of ResIN 2.3.0 and ignored.
- bipartite
Retired as of ResIN 2.3.1 and ignored. Please set
multimodalargument instead.- seed
Random seed for force-directed algorithm. Defaults to NULL (no seed is set.) If scalar integer is supplied, that seed will be set prior to analysis.
Value
An edge-list type data-frame, ResIN_edgelist, a node-level data-frame, ResIN_nodeframe, an n*2 data-frame of individual-level spatial scores along the major (x) and minor(y) axis, ResIN_scores a list of graph-level statistics graph_stats including (graph_structuration), and centralization (graph_centralization). Further, a multimodal_output list which includes an igraph class multimodal graph (multimodal_igraph), a data frame, coordinate_df, with spatial coordinates of respondents, and a plot-able ggraph-object called multimodal_ggraph is optionally generated. Lastly, the output includes a list of auxiliary objects, aux_objects, including the ResIN adjacency matrix (adj_matrix), an alternate version of the adjacency matrix with all negative edges retained, a numeric vector detailing which item responses belong to which item (same_items), and the dummy-coded item-response data-frame (df_dummies). For reproducibility, (aux_objects$meta stores a numeric dataframe identifier (df_id, the random seed, call, and the (ResIN package version used to create the object.”
Examples
## Load the 12-item simulated Likert-type toy dataset
data(lik_data)

# Apply the ResIN function to toy Likert data:
ResIN_obj <- ResIN(lik_data, network_stats = TRUE, remove_nonsignificant = TRUE)